Comparing Discrete and Continuous Data Visualization in ActiveAnalysis
A new feature in the GrapeCity ActiveAnalysis Beta is the ability to switch between Discrete and Continuous attributes.
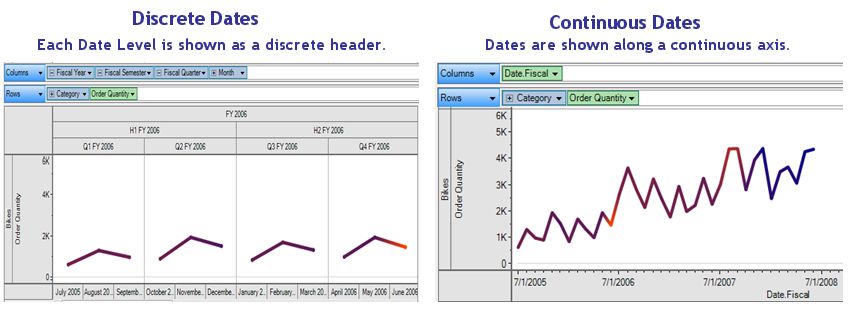
This feature is particularly useful for analyzing data across Dates where you would not only want to plot data against discrete Date values as mapped from the database but would also like to better discover any trends in the data for a given time span.
ActiveAnalysis can take discrete values of specific types (numbers or dates) and display them as series of data along a continuous axis. This results in two benefits:
- Display more information in less space.
- Understand data trends for a given time span.
All attributes and hierarchies can be switched to continuous mode, although not all types of attribute fields make sense in continuous mode. ActiveAnalysis displays the results if it makes sense; otherwise, no values are displayed.
Each member must be able to produce its own continuous value, which is only possible in some situations. This is because ActiveAnalysis cannot determine whether an attribute or hierarchy has continuous data; it simply tries to interpret the data as continuous and display it if possible.
As mentioned earlier, the value must be a Number or a Date type to be displayed in continuous mode.

MESCIUS inc.